



Skymap is a Ruby library for generating maps of the sky.
Warning
This project is in its very early stages, please expect breaking changes.
Install the gem and add it to the application's Gemfile by executing:
bundle add skymapIf Bundler is not being used to manage dependencies, install the gem by executing:
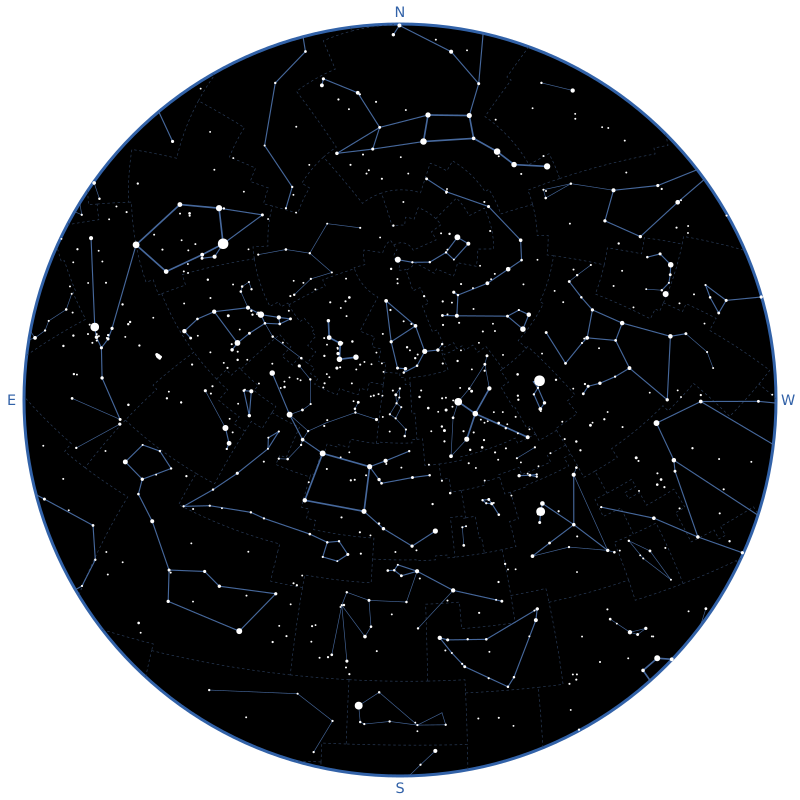
gem install skymapSkymap draws the sky seen by an observer at a given instant, and returns it as an SVG string. This is the map above:
require "skymap"

Astronoby::Ephem.download(name: "inpop19a.bsp", target: "inpop19a.bsp")
ephem = Astronoby::Ephem.load("inpop19a.bsp")

observer = Astronoby::Observer.new(
  latitude: Astronoby::Angle.from_degrees(48.8575),
  longitude: Astronoby::Angle.from_degrees(2.3514)
)
instant = Astronoby::Instant.from_time(Time.utc(2026, 9, 23, 20))
canvas = Skymap::Canvas.new(size: 800, padding: 24)
stars = Skymap::Catalog::Stars.new
lines = Skymap::Catalog::ConstellationLines.new.to_a

chart = Skymap::Chart.new(observer: observer, instant: instant, canvas: canvas)
svg = chart.render(
  Skymap::Layers::ConstellationBoundaries.new(
    boundaries: Skymap::Catalog::ConstellationBoundaries.new
  ),
  Skymap::Layers::Ecliptic.new,
  Skymap::Layers::ConstellationLines.new(lines: lines, stars: stars),
  Skymap::Layers::Stars.new(stars: stars),
  Skymap::Layers::ConstellationNames.new(lines: lines, stars: stars),
  Skymap::Layers::Planets.new(ephem: ephem, labels: true),
  Skymap::Layers::Moon.new(ephem: ephem),
  Skymap::Layers::CardinalDirections.new
)

File.write("sky_map.svg", svg)
The observer and the instant are Astronoby objects. Astronoby computes where each star is in the sky and Skymap draws it. The Moon and the planets need an ephemeris, which the first lines download and load (see Moon). Every layer is optional: leave one out to hide what it draws.
The map at the top of this page is generated by bin/build_readme_map, which
runs this code with the ephemeris of the tests.
The map is a disk: the zenith is at the center and the horizon is the edge. It uses a stereographic projection, the most common one for sky charts because it keeps the shapes of constellations, even near the horizon. North is at the top and East is on the left, as on a map you would hold above your head.
The canvas is the square SVG the map is drawn on. size is its width and
height, and padding is the space between the horizon and the edge of the
SVG.
The SVG is written in pixels by default. To print it at a known size, give the
canvas a print_size:: the length of the side of the square, in millimeters
(:mm), centimeters (:cm) or inches (:in):
canvas = Skymap::Canvas.new(
  size: 800,
  padding: 24,
  print_size: Skymap::PrintSize.new(length: 190, unit: :mm)
)
The SVG gets width="190mm" and height="190mm", and its viewBox stays in the
units of the canvas, so the map is the same and a browser or a print dialog
prints it at 190 mm.
Skymap::PrintSize.paper gives the largest square that fits in the width of a
sheet of paper, minus a margin of 10 mm on each side by default (margin:, in
millimeters). The papers are :a5, :a4, :a3, :letter and :tabloid:
Skymap::PrintSize.paper(:a4)                # 190 mm
Skymap::PrintSize.paper(:letter, margin: 5) # 205.9 mm
Add a scale to the map to read angles on the printed chart.
By default, the map is the whole sky. Pass a view: to zoom on an area of it:
the center of the area, as the equatorial coordinates of a point of the sky, at
J2000 or at the date of the chart (or horizontal coordinates), and the field of
view, the angle between the opposite sides of the map:
view = Skymap::View.new(
  center: Astronoby::Coordinates::Equatorial.new(
    right_ascension: Astronoby::Angle.from_hours(5.6),
    declination: Astronoby::Angle.zero,
    epoch: Astronoby::JulianDate::J2000
  ),
  field_of_view: Astronoby::Angle.from_degrees(50)
)

chart = Skymap::Chart.new(
  observer: observer,
  instant: instant,
  canvas: canvas,
  view: view
)
Equatorial coordinates at any other epoch raise an ArgumentError. The field
of view is an Astronoby::Angle of more than 0 and up to 180 degrees. The sky
is still seen from the observer. By default, the zenith is at the top of the
map, except when the zenith is in the view: the north is at the top then, as in
the whole sky. The next section changes that. With
horizontal coordinates, only the altitude and the azimuth are used, as seen by
the observer of the chart. The layers draw what is in the view only. The
horizon is drawn as a line when it is in the view, and the edge of the map is a
thin outline. It is no longer the horizon, so the cardinal directions are not
drawn. The Sun and the Moon are drawn at their size in the sky once it is
larger than their usual size on the map. The stars come from a catalog that
goes down to magnitude 9: draw them with magnitude_limit: 9 in a zoomed view
to fill it.
A map in a telescope is turned in a way that depends on the telescope and on
its mount. Three options of View give the same orientation on the map:
orientation: :zenith_up(the default) keeps the zenith at the top, like an alt-az mount does at the meridian.orientation: :equatorialputs the north celestial pole at the top and the east on the left, like the sky seen through an equatorial mount.rotation:turns the map clockwise, by anAstronoby::Angle.mirrored: trueswaps the left and the right, before the rotation.
On an equatorial mount, a refractor or a catadioptric telescope with a diagonal shows a mirrored image, and a Newtonian shows the sky turned by half a turn:
field_of_view = Astronoby::Angle.from_degrees(4)

Skymap::View.new(
  center: center,
  field_of_view: field_of_view,
  orientation: :equatorial
)
Skymap::View.new(
  center: center,
  field_of_view: field_of_view,
  orientation: :equatorial,
  mirrored: true
)
Skymap::View.new(
  center: center,
  field_of_view: field_of_view,
  orientation: :equatorial,
  rotation: Astronoby::Angle.from_degrees(180)
)
The north is the one of the celestial pole of the date, in both hemispheres. The lit side of the Moon follows the orientation too.
Stars are drawn where they are at the date of the chart, not at their catalog
position: their proper motion is applied from J2000 to the instant of the chart,
then the position is precessed and nutated to the true equator and equinox of
date, and seen from the observer. Skymap::Star#coordinates_at(instant) gives
the first step, as Astronoby::Coordinates::Equatorial at J2000. A star without
a proper motion stays where it is, at any epoch; with a proper motion, its
coordinates must be at J2000, or Skymap::Star raises an ArgumentError. For a
star that has a proper motion but no parallax or no radial velocity, which is
the case of a third of the stars for the parallax in the Bright Star Catalogue
and of a fifth of the others for the radial velocity, a parallax of 1
milliarcsecond and a radial velocity of 0 are assumed: the position changes by
less than 0.1 arcsecond. To keep the charts fast, the proper motion is left out of a star that
it moves by less than 0.005 pixel on the chart, so a star is drawn within 0.005
pixel of where the full propagation puts it.
These are not applied:
- the annual aberration of light, up to about 20 arcseconds
- the annual parallax, under 1 arcsecond
- the atmospheric refraction, which lifts a star near the horizon by up to half a degree
- the rounding of the positions of the Bright Star Catalogue, about 1 arcsecond
The proper motion is visible in charts with a field of view under a degree: Arcturus moves by 1 arcminute in 27 years. In a larger field, it is smaller than a pixel for most stars.
A theme gives the colors of the map. Chart draws the dark theme by default,
light stars on a black sky. Pass theme: to draw another one:
chart = Skymap::Chart.new(
  observer: observer,
  instant: instant,
  canvas: canvas,
  theme: Skymap::Theme.light
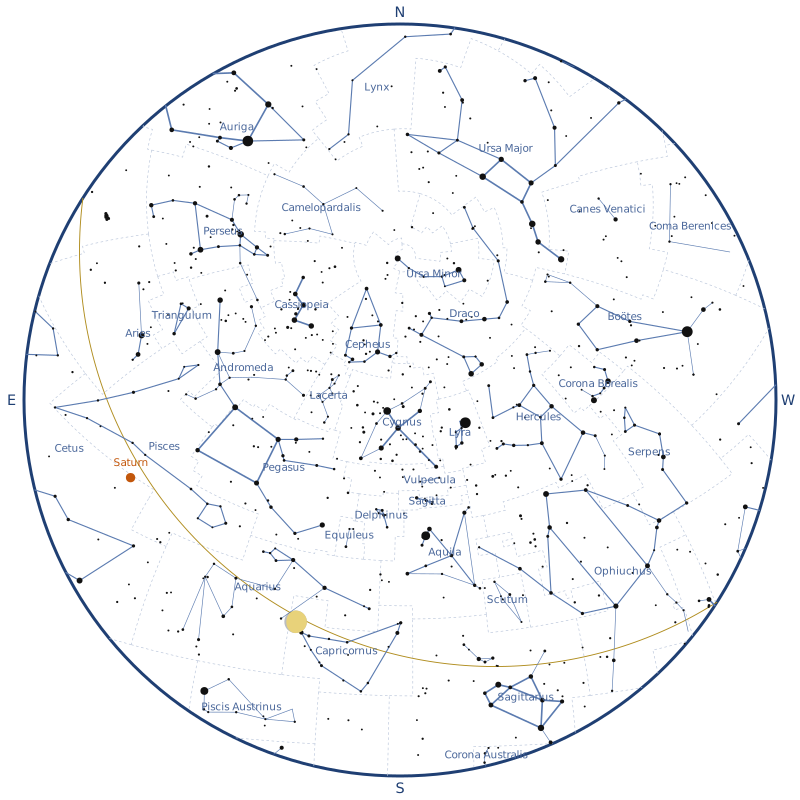
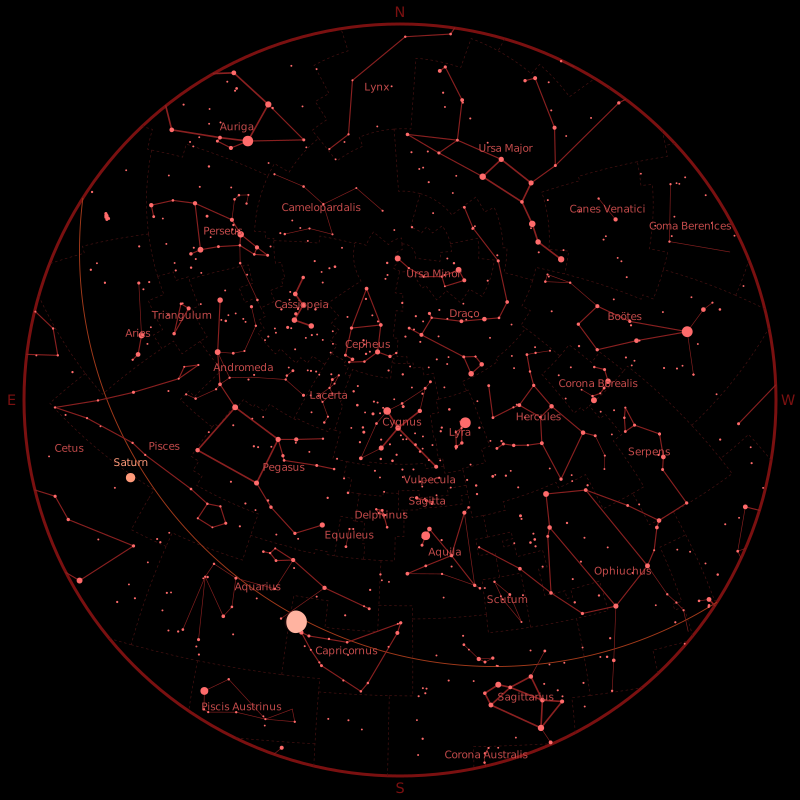
)Skymap::Theme.dark: the default.Skymap::Theme.light: dark stars on a white sky, for printing.Skymap::Theme.night: shades of red on a black sky, which keep your eyes adapted to the dark when you use the map outside.
Build your own from a built-in one, changing the colors you want. Each color
is a string SVG accepts, such as "#ffeedd" or "gold":
theme = Skymap::Theme.dark.with(
  sky: "#0b1026",
  star: "#fff4d6"
)
Use "none" as a color to leave something out. The dark theme has
background: "none", so the SVG is transparent around the sky, and with
sky: "none" the sky is transparent too, to put the map on a background of
your own. With horizon: "none", the edge of the sky is not outlined.
The theme reference lists every color and shows how to build a theme from scratch.
A map is the sky, with the layers given to Chart#render drawn on top of it,
in order: each layer is drawn over the previous ones. Without layers,
Chart#render draws an empty sky. Leave a layer out to hide what it draws.
Labels never overlap. A label is written above or below its object, and moves to another side of it when that place is taken by another label, a deep-sky symbol, a planet, the Sun, the Moon or a bright star. A label with no room around its object is left out, so a crowded field shows fewer labels, and a larger map or a smaller field shows more. Labels of fields, planets, stars and deep-sky objects are placed in this order, and the brighter objects come first among deep-sky objects. The names of the constellations, the scale and the cardinal directions stay where they are.
Skymap::Layers::Stars draws stars, bigger the brighter they are.
Skymap::Catalog::Stars gives the 130,556 stars down to magnitude 9 (see
Data sources), but the layer accepts any list of
Skymap::Star. Pass the catalog itself rather than to_a: it builds only the
stars the layer asks for, the ones brighter than magnitude_limit: and, in a
zoomed view, near the view. Building the 130,556 of them takes seconds and
hundreds of megabytes.
Stars are drawn at their position at the date of the chart, with their proper motion applied (see Accuracy).
By default, only stars of magnitude 5 or brighter are drawn, which is about
what you can see from a suburban sky. Use magnitude_limit: to draw more or
fewer stars:
Skymap::Layers::Stars.new(stars: stars, magnitude_limit: 6)Skymap::Layers::StarNames writes the names of the brightest stars, next to
them, on the side of the center of the map. A name next to the horizon is moved
towards the center until it fits in the sky, as far as the width of the text
can be estimated. It takes the same stars as the stars layer, and
Skymap::Catalog::StarNames gives the names of 333 stars of the catalog, as
approved by the IAU (see Data sources):
Skymap::Layers::StarNames.new(stars: stars)Only the stars of magnitude 2 or brighter are named by default, which is about
fifty stars. Use magnitude_limit: to name more or fewer stars:
Skymap::Layers::StarNames.new(stars: stars, magnitude_limit: 3)Names sit just outside the dots of the stars. Dots get smaller as the stars
layer draws fainter stars, so if you give it a magnitude_limit: other than 5,
give the same one to stars_magnitude_limit::
Skymap::Layers::Stars.new(stars: stars, magnitude_limit: 6)
Skymap::Layers::StarNames.new(stars: stars, stars_magnitude_limit: 6)
Use names: to write the names differently: it takes anything that gives a
name from the Harvard Revised number of a star (hr), such as a hash. A star
without a name is left out:
Skymap::Layers::StarNames.new(
  stars: stars,
  names: {2491 => "Sirius", 424 => "Étoile polaire"}
)Skymap::Layers::ConstellationBoundaries draws the boundaries between the
constellations as thin dashed lines, and stops the ones that cross the horizon
at the edge of the sky. Skymap::Catalog::ConstellationBoundaries gives the
borders of the 88 IAU constellations (see Data sources).
Layers are drawn in the order they are given: put the boundaries first to draw them below the lines and the stars.
Skymap::Layers::ConstellationLines draws the lines of the constellations.
Skymap::Catalog::ConstellationLines gives the lines of the 88 IAU
constellations (see Data sources).
Figures are drawn whole, even when some of their stars are fainter than the magnitude limit of the stars layer, and lines that cross the horizon stop at the edge of the sky. The stars given to the layer must include the stars of the lines: lines to a star that is not given are left out.
Each line has a weight, as drawn on the IAU charts: bold for the best-known
shapes (the asterisms, such as the Big Dipper or the Teapot of Sagittarius),
normal for the rest of the figures and thin for the secondary lines. The
layer draws the lines it's given, so select the ones you want, for example
only the asterisms:
asterisms = Skymap::Catalog::ConstellationLines.new.select do |line|
  line.weight == :bold
end

Skymap::Layers::ConstellationLines.new(lines: asterisms, stars: stars)Skymap::Layers::ConstellationNames writes the name of each constellation in
the middle of its stars. It takes the same lines and stars as the
constellation lines layer, since the lines tell which stars belong to which
constellation:
lines = Skymap::Catalog::ConstellationLines.new.to_a

Skymap::Layers::ConstellationNames.new(lines: lines, stars: stars)
Reading the lines into an array with to_a, once, saves the layers from
reading the file again each.
A constellation is named when more than half of its stars are above the horizon. When its figure is in several parts, such as Serpens, the name goes in the middle of the biggest part that is above the horizon. Mensa and Microscopium have no lines, so they have no name on the map.
The names are in English, from Skymap::Catalog::ConstellationNames. Use
names: to write them differently: it takes anything that gives a name from
the IAU abbreviation of a constellation, such as a hash. A constellation
without a name is left out:
Skymap::Layers::ConstellationNames.new(
  lines: lines,
  stars: stars,
  names: {"UMa" => "Grande Ourse", "UMi" => "Petite Ourse"}
)Skymap::Layers::DeepSkyObjects draws galaxies, clusters, nebulae and other
deep-sky objects. Skymap::Catalog::DeepSkyObjects gives the 109 Messier
objects and the NGC and IC objects of magnitude 12 or brighter, 1,741 in all
(see Data sources), but the layer accepts any list of
Skymap::DeepSkyObject, such as the objects you pick from the catalog:
objects = Skymap::Catalog::DeepSkyObjects.new

Skymap::Layers::DeepSkyObjects.new(objects: objects)
messier? tells the Messier objects from the others, so you can draw only
those:
Skymap::Layers::DeepSkyObjects.new(objects: objects.select(&:messier?))Each type of object has its own symbol, drawn as an outline in the deep_sky
color of the theme, as in most atlases:
type |
Symbol |
|---|---|
galaxy |
an ellipse |
globular_cluster |
a circle with a cross |
open_cluster |
a dashed circle |
planetary_nebula |
a circle with four ticks around it |
nebula |
a dashed square with rounded corners |
supernova_remnant |
a dashed circle with a dot at its center |
asterism |
a dotted circle |
double_star |
a small circle with a bar through it |
other |
a small cross |
By default, objects of magnitude 11 or brighter are drawn, which keeps every
Messier object, and an object without a magnitude is always drawn. Use
magnitude_limit: to draw fewer objects, or up to 12 to draw all of the
catalog, or select the objects you want. The magnitude of an object is a
visual one unless its magnitude_band is :blue, as for 65 faint NGC and IC
objects that only have a blue magnitude, which is about a magnitude fainter for
most objects:
galaxies = objects.select { |object| object.type == :galaxy }

Skymap::Layers::DeepSkyObjects.new(objects: galaxies, magnitude_limit: 9.5)
An object has the size of the symbol on the map, which is small, until its
size in the sky is larger: it is then drawn at its real size, which you see
when you zoom in with a view. A small object keeps its proportions in
the symbol, and an object with no known size, such as M40, is drawn with the
smallest symbol. A round object is a circle. An elongated object is an ellipse
turned the way the object is, as position_angle gives it, from the north
through the east: the layer follows the orientation of the
view, its rotation and its mirror, and the whole sky. An elongated object
without a position angle (M1, M8, M16, M42 and M43) is not turned, as nothing
says which way: it is drawn as a circle with the same area as the ellipse,
whose diameter is the square root of the product of its axes.
With labels: true, the designation of each object (such as M31) is written
next to its symbol, in the deep_sky color too. Objects below the horizon or
outside the view are left out. Give the layer after the stars to draw its
symbols over them.
Skymap::Layers::Moon draws the Moon where it is in the sky, with its phase.
The lit side of the Moon faces the Sun on the map: the Moon is turned with the
projection, wherever it is on the map and whatever the orientation of the view.
Astronoby needs an ephemeris to compute where the Moon is: download one once, load it and give it to the layer (see the Astronoby documentation to pick one):
Astronoby::Ephem.download(name: "inpop19a.bsp", target: "inpop19a.bsp")
ephem = Astronoby::Ephem.load("inpop19a.bsp")

Skymap::Layers::Moon.new(ephem: ephem)
The Moon is drawn larger than it is, as on most sky maps: at its true size it would be a dot as small as the faintest stars. Its radius is 3% of the radius of the sky. When the center of the Moon is below the horizon, it is left out.
Skymap::Layers::Sun draws the Sun where it is in the sky. Like the Moon, it
needs an ephemeris (see Moon):
Skymap::Layers::Sun.new(ephem: ephem)The Sun is drawn larger than it is, at the same size as the Moon: 3% of the radius of the sky. When the center of the Sun is below the horizon, it is left out.
Skymap::Layers::Planets draws the planets, from Mercury to Neptune, where
they are in the sky. They need an ephemeris too (see Moon). A planet
is drawn as a star would be, bigger the brighter it is, with a warm tint so it
stands out from the stars:
Skymap::Layers::Planets.new(ephem: ephem)As for the stars, only planets of magnitude 5 or brighter are drawn by
default, which leaves out Uranus and Neptune. Use magnitude_limit: to draw
more or fewer planets. The magnitude of a planet changes over time, so a
planet can come in and out of the map:
Skymap::Layers::Planets.new(ephem: ephem, magnitude_limit: 6)Planets below the horizon are left out.
Use labels: true to write the name of each planet next to it, on the side of
the center of the map so it stays inside the sky:
Skymap::Layers::Planets.new(ephem: ephem, labels: true)The names are in English. Use names: to write them differently, with a hash
of the planets (:mercury, :venus, :mars, :jupiter, :saturn,
:uranus and :neptune). A planet without a name is drawn without it:
Skymap::Layers::Planets.new(
  ephem: ephem,
  labels: true,
  names: {saturn: "Saturne", jupiter: "Jupiter"}
)Skymap::Layers::Ecliptic draws the ecliptic, the line the Sun follows in the
sky over a year. The Moon and the planets are always close to it. It needs no
data, and it stops at the horizon:
Skymap::Layers::Ecliptic.newSkymap::Layers::Grid draws the celestial coordinate grid: the lines of right
ascension and the circles of declination, including the celestial equator. They
are the coordinates of the stars in a catalog, and the grid shows where the
sky turns around the celestial pole. It needs no data, and it stops at the
horizon:
Skymap::Layers::Grid.newThe lines are 30 degrees apart (2 hours of right ascension) by default. Use
step:, an Astronoby::Angle, to draw them closer or further apart. It is
between 1 and 90 degrees and divides 360 degrees. For a line of right ascension
every hour:
Skymap::Layers::Grid.new(step: Astronoby::Angle.from_hours(1))By default the grid is in the equator and equinox of J2000, like the
coordinates of atlases and catalogs. Use epoch: :of_date to draw it in the
true equator and equinox of the date of the chart instead. The declination
circles are then centered on the true celestial pole of that date, which is
what a polar-aligned equatorial mount shows:
Skymap::Layers::Grid.new(epoch: :of_date)The two grids differ by a fraction of a degree today, which only shows when the
map is zoomed on a small area of the sky. For a view that follows a
polar-aligned equatorial mount, use :of_date, which pairs with
orientation: :equatorial (north celestial pole at the top). Keep :j2000 to
read coordinates off the grid and look them up in an atlas or a catalog.
Give the grid first to Chart#render to draw the stars and the other layers
over it.
Skymap::Layers::FieldCircles draws circles that show what a finder scope or an
eyepiece covers in the sky. Give it the fields to draw, as Skymap::Field or
Skymap::Setup objects (see Telescope, eyepiece and fields):
Skymap::Layers::FieldCircles.new(fields: [finder, setup], labels: true)The circles are centered on the center of the view, so the layer needs
a view, and nothing is drawn without one. Use center: to draw them around
another point, as the equatorial or horizontal coordinates of a point of the
sky, such as a target when the view is wider than the circles:
Skymap::Layers::FieldCircles.new(fields: [setup], center: target)A circle has the size of its field on the sphere, then it is projected, so it
keeps its size and its shape anywhere in the map. Each circle and its label are drawn in
the field_circle color of the theme. In a view, a circle is
drawn whole, even below the horizon, and a circle that does not reach the view
is left out. In the whole sky, which has no center unless you give a center:,
a circle stops at the horizon.
With labels: true, the label of each field is written next to its circle.
A label that would fall outside the view is left out. Give the layer last to
Chart#render to draw the circles over the stars.
Skymap::Layers::CardinalDirections labels the cardinal directions (N, E, S,
W) in the padding, with a size that follows it: a padding of about 3% of the
size gives readable labels. It draws nothing when the map has a view.
Skymap::Layers::Scale draws a scale bar with its length as a label, such as
1°, 30′ or 10″, in the lower left of a map with a view. It draws
nothing on the whole sky, where the scale changes from one place to another:
Skymap::Layers::Scale.newThe bar is the longest of 1, 2, 5, 10, 20 and 30 arc-seconds, arc-minutes or
degrees that is at most a fifth of the width of the map. It stays horizontal
and the same in every orientation of the view. The scale of the map
changes from the center to the edge, and the bar follows it: its length is the
angle it says at the place where it is drawn. A straight bar on the map is a
small circle on the sky, not the shortest path between its ends, so the angle
between the ends is a little smaller than the label on wide fields. The
difference is below 0.01% up to a field of view of 90 degrees, which covers
finder charts, and at most 0.1% at 120 degrees and 0.3% at 180 degrees. Nothing
is drawn when even 1 arc-second is too long, for a field of view below about
0.0014 degrees (5 arc-seconds). The bar and its label use the scale
color of the theme. With a print size, the bar is as long on
paper as the angle it says.
An eyepiece in a telescope shows a small part of the sky, often less than a degree wide. These classes describe the equipment, compute that part of the sky, and give it to a view or to the field circles.
Skymap::Telescope has a focal length and an aperture, in millimeters, as
focal_length_mm and aperture_mm. Skymap::Eyepiece has a focal length in
millimeters, as focal_length_mm, and the apparent field of view that its
maker gives, as an Astronoby::Angle. All the numbers must be above 0, and
the apparent field of view up to 180 degrees:
telescope = Skymap::Telescope.new(focal_length_mm: 1200, aperture_mm: 200)
eyepiece = Skymap::Eyepiece.new(
  focal_length_mm: 25,
  apparent_field_of_view: Astronoby::Angle.from_degrees(52)
)
Skymap::Setup pairs a telescope with an eyepiece, and computes what you see
with them:
setup = Skymap::Setup.new(telescope: telescope, eyepiece: eyepiece)

setup.magnification # => 48.0
setup.true_field    # => an Astronoby::Angle of 1.083 degrees
setup.label # => "25 mm, 48×, 1.1°"magnificationis the focal length of the telescope divided by the one of the eyepiece, as aFloat.true_fieldis the part of the sky you see, as anAstronoby::Angle: the apparent field of view divided by the magnification, the usual first-order formula. With a Barlow lens or a focal reducer, give the effective focal length of the telescope. It is whatfield_of_view:of a view takes, to draw a map as wide as the eyepiece.labelis a short text for the circle: the focal length of the eyepiece, the magnification and the true field, in degrees (with at most one decimal) from 1 degree, in arcminutes (15′) below, and in arcseconds (30″) below one arcminute.
Skymap::Field is a field that does not come from a setup, such as a finder
scope, a Telrad ring or the frame of a camera: its true_field as an
Astronoby::Angle, and the label you choose:
finder = Skymap::Field.new(
  true_field: Astronoby::Angle.from_degrees(5),
  label: "Finder 5°"
)
FieldCircles takes anything with a true_field and a label, so a list of
fields and setups draws them together around a target, on a map twice as wide
as the eyepiece:
view = Skymap::View.new(
  center: target,
  field_of_view: Astronoby::Angle.from_degrees(
    setup.true_field.degrees * 2
  )
)

chart = Skymap::Chart.new(
  observer: observer,
  instant: instant,
  canvas: canvas,
  view: view
)
svg = chart.render(
  Skymap::Layers::Stars.new(stars: stars, magnitude_limit: 7),
  Skymap::Layers::FieldCircles.new(fields: [finder, setup], labels: true)
)The examples folder has scripts and the maps they draw, for different combinations of layers, themes and observers: the naked-eye sky, a printable map of the constellations, the planets, a night vision map for outdoors, the southern sky, the galaxies of Virgo and more. Start from the one closest to what you want to draw.
data/stars.bin is the star catalog of Skymap::Catalog::Stars: 130,556
stars down to magnitude 9, in a binary file of 2.6 MB that the catalog reads
by magnitude and by area of the sky, so that a view of a few degrees reads a few
hundred stars out of the file. Each star has its J2000 coordinates, its visual
magnitude and its astrometry, blank when unknown: the proper motion in right
ascension (proper_motion_ra, which includes the cosine of the declination) and
in declination (proper_motion_dec) in mas/yr, the parallax in mas and the
radial_velocity in km/s. Skymap::Catalog::Stars loads them as an
Astronoby::AngularVelocity, an Astronoby::Angle and an
Astronoby::Velocity on Skymap::Star. They are all optional, so a list of
your own stars can leave them out: the proper motions are given together, and
the parallax and the radial velocity are nil when unknown.
The file merges the stars of two sources:
- the 9,096 stars of the Yale Bright Star Catalogue, 5th Revised Edition
(VizieR V/50), with their Harvard Revised number (
hr), extracted indata/stars.csv. They keep their values: a proper motion for each of them, a parallax for 3,100 (387 of them are dynamical parallaxes, not trigonometric ones) and a radial velocity for 9,090. The 14 non-stellar entries kept only for numbering are left out - the 121,460 other stars of Tycho-2 down to magnitude 9, with no Harvard Revised number. The visual magnitude is computed from the Tycho magnitudes with V = VT - 0.090 (BT - VT), which gives the magnitude of the Bright Star Catalogue to 0.001 at the median. The proper motion is the one of Tycho-2, and the parallax and the radial velocity are the ones of Gaia DR3, or the parallax of the new reduction of Hipparcos when Gaia has none: 100% of the stars have a proper motion, 97% a parallax and 79% a radial velocity. The position of the few hundred stars for which Tycho-2 only gives the position observed around 1991 comes from Gaia or Hipparcos, brought to J2000 with their proper motion. A star of Tycho-2 is left out when it is already in the Bright Star Catalogue: within 5 arcseconds, plus 5 years of its proper motion, and 0.5 magnitude
The file is generated with bin/build_stars, which reads data/stars.csv and
queries the ESA Gaia archive, where ESA also serves Tycho-2 and
Hipparcos. bin/build_catalog generates data/stars.csv from the Bright Star
Catalogue, which it downloads from CDS. data/stars.csv is not part of the
gem: the gem has data/stars.bin only.
The data of Gaia, Hipparcos and Tycho come from ESA, which distributes them
under CC BY-NC 3.0 IGO: the file is released under the same
license, with the credits "Credit: ESA, Gaia DPAC" and "Credit: ESA", and ESA
asks to be contacted before any use that generates a financial gain. The
license and the terms are in data/LICENSE-stars.txt, shipped with the gem. The
code stays under the MIT license.
Hoffleit, D., Warren Jr., W. H., 1991, The Bright Star Catalogue, 5th Revised Ed. (Preliminary Version), Astronomical Data Center, NSSDC/ADC.
Høg, E. et al., 2000, The Tycho-2 catalogue of the 2.5 million brightest stars, A&A 355, L27.
van Leeuwen, F., 2007, Validation of the new Hipparcos reduction, A&A 474, 653.
Gaia Collaboration, 2016, The Gaia mission, A&A 595, A1; Gaia Collaboration, 2023, Gaia Data Release 3: Summary of the content and survey properties, A&A 674, A1.
This work has made use of data from the European Space Agency (ESA) mission Gaia (https://www.cosmos.esa.int/gaia), processed by the Gaia Data Processing and Analysis Consortium (DPAC, https://www.cosmos.esa.int/web/gaia/dpac/consortium).
This research has made use of the VizieR catalogue access tool, CDS, Strasbourg, France (DOI: 10.26093/cds/vizier). The original description of the VizieR service was published in 2000, A&AS 143, 23.
data/star_names.csv gives the name of 333 stars of data/stars.csv from
their Harvard Revised number (hr), as listed in the IAU Catalog of Star
Names by the IAU Working Group on Star Names. The catalog also names
stars that are not in the Bright Star Catalogue, such as the host stars of
exoplanets, which are left out.
The file is generated with bin/build_star_names, which downloads the list
and keeps the stars with an HR number. The IAU asks to cite its official
version of the list at https://www.iau.org/public/themes/naming_stars/, and
releases its products under a Creative Commons Attribution license.
data/constellations/iau/lines.csv holds the lines of the 88 IAU
constellations (Mensa and Microscopium have none), one row per segment:
constellation: the IAU abbreviation of the constellation.from_hr,to_hr: the ends of the segment, as HR numbers of stars ofdata/stars.csv. An end with two HR numbers, such as5190 5193, is the midpoint of these two stars: the IAU charts draw some lines to a pair of close stars rather than to one of them.weight:boldfor the lines the charts draw thickest, the best-known shapes such as the Big Dipper or the Teapot of Sagittarius,normalfor the rest of the main figures,thinfor the secondary lines.
The lines are transcribed from the IAU constellation maps of the IAU Office of Astronomy for Education, adapted from the original charts by the IAU and Sky & Telescope magazine (Roger Sinnott & Rick Fienberg), with the constellation patterns of Alan MacRobert, and released under the Creative Commons Attribution 4.0 International license.
The file was transcribed once from the vector PDF of each map, by matching the ends of the lines drawn on the maps to the stars of the catalog, and checked against the maps. It is not regenerated by a script.
data/constellations/iau/names.csv gives the English name of each of the 88
IAU constellations from its IAU abbreviation, as listed by the International
Astronomical Union.
data/constellations/iau/boundaries.csv holds the borders between the 88 IAU
constellations, one row per point of a border, in order:
border: the number of the border. Each border between two constellations is listed once.constellations: the IAU abbreviations of the two constellations the border separates.right_ascension(hours) anddeclination(degrees): the coordinates of the point, in J2000. The borders of the constellations are straight lines of right ascension and declination in B1875, and curves in J2000: there is a point about every degree to follow them.
The borders come from the Catalogue of Constellation Boundary Data by Davenhall and Leggett (VizieR VI/49), in the version of Bill J. Gray that lists the constellation on each side of a border. They are the boundaries defined by Delporte in 1930, in B1875 coordinates.
Davenhall, A. C., Leggett, S. K., 1989, Catalogue of Constellation Boundary Data, Royal Observatory Edinburgh.
The file is generated with bin/build_boundaries, which downloads the
catalog from CDS, keeps each shared border once, adds the points along the
borders and precesses them to J2000 with Astronoby.
data/deep_sky_objects.csv holds 1,741 deep-sky objects, from
OpenNGC (release v20260501, commit 36cb178), one row per object:
the 109 Messier objects, then the 1,496 NGC and 136 IC objects of magnitude 12
or brighter that are not Messier objects.
designation:M31for a Messier object,NGC 7000orIC 434for the others, without zero padding.name: the first common name of OpenNGC, blank when it has none.type: one of the types below.right_ascension(hours) anddeclination(degrees): J2000 coordinates.magnitude: the visual (V) magnitude, or the blue (B) one when there is no V magnitude. Every object has one, and every Messier object has a V magnitude.magnitude_band:VorB, the band of themagnitude.major_axisandminor_axis: the size in arcminutes, blank when unknown.position_angle: the angle of the major axis in degrees, from the north through the east, blank when unknown. OpenNGC only gives it to galaxies, M24 and the Pleiades.
The OpenNGC types become these ones:
| OpenNGC | type |
|---|---|
G, GPair, GTrpl, GGroup |
galaxy |
OCl |
open_cluster |
GCl |
globular_cluster |
PN |
planetary_nebula |
Neb, HII, EmN, RfN, Cl+N |
nebula |
SNR |
supernova_remnant |
*Ass |
asterism |
** |
double_star |
Other |
other |
M42 is the only Messier object of OpenNGC type Cl+N, a cluster with
nebulosity: it is a nebula, as its nebulosity is far larger than the
Trapezium cluster at its center. M24 (a star cloud) is an asterism, M73 is
other, and M40 is a double_star: OpenNGC lists it with no size. Any other
OpenNGC type stops the build.
Skymap::Catalog::DeepSkyObjects loads them as Skymap::DeepSkyObject, with
the sizes as Astronoby::Angle. A minor_axis is blank for most clusters and
some nebulae: Skymap::DeepSkyObject takes it as a round object, with a
minor_axis equal to its major_axis. Both are nil when the size is unknown
(M40, M73).
OpenNGC identifies M102 as a duplicate of M101 (its identity is controversial
and it follows the assumption of NED), so M102 is left out and the file has no
M102. M40 and M45 are not in the NGC and IC catalogs: they come from the
addendum of OpenNGC, where the Pleiades are listed as Melotte 22.
The file leaves out the objects of OpenNGC that are not in the sky or not
objects (duplicates, non-existent objects, stars, novae and dark nebulae), the
components of a galaxy listed apart (such as NGC 520 NED01), the objects of
the addendum other than M40 and M45, and every NGC and IC object without a
magnitude or fainter than magnitude 12. This keeps the objects you can look
for in an amateur telescope, without the thousands of faint galaxies.
The file is generated with bin/build_deep_sky_objects, which downloads
NGC.csv and addendum.csv from the pinned commit of OpenNGC and keeps these
objects. Pass the path of a local directory holding the two files to build from
it. The output must not change when you run it again.
OpenNGC is released under the Creative Commons Attribution-ShareAlike 4.0
International license, and so is data/deep_sky_objects.csv: the
license, with the credits and changes, is in
data/LICENSE-deep_sky_objects.txt, shipped with the gem. If you share this
file or data adapted from it, you must release your version under the same
license. The code of Skymap stays under the MIT license.
OpenNGC merges the data of the NASA/IPAC Extragalactic Database (NED), HyperLEDA, SIMBAD, the HEASARC archive and Harold Corwin's NGC/IC Positions and Notes. This research has made use of the NASA/IPAC Extragalactic Database (NED), which is operated by the Jet Propulsion Laboratory, California Institute of Technology, under contract with the National Aeronautics and Space Administration, of the HyperLEDA database, and of the SIMBAD database, operated at CDS, Strasbourg, France.
The tests of the Sun, the Moon and the planets use
spec/fixtures/de440s_2025_2030_excerpt.bsp, an excerpt of DE440s, the
planetary and lunar ephemeris of the Jet Propulsion Laboratory,
distributed by NAIF. It only keeps the barycenters of the planets, the
Sun, the Moon and the Earth, from 2025 to 2030. As NAIF asks for modified
kernels, its comment area names this project as the last to modify it, and
points to the original kernel. It is not part of the gem.
Park, R. S., Folkner, W. M., Williams, J. G., Boggs, D. H., 2021, The JPL Planetary and Lunar Ephemerides DE440 and DE441, The Astronomical Journal, 161, 105.
After checking out the repo, run bin/setup to install dependencies. Then, run
bundle exec rake to run the tests and the linter. You can also run
bin/console for an interactive prompt that will allow you to experiment.
- Tests:
bundle exec rspec - Linter (Standard Ruby through RuboCop):
bundle exec rubocop(bundle exec rubocop -ato autocorrect) - Render times of representative charts:
bin/benchmark(RUNS=10to change the number of runs it keeps the best of) - Everything CI checks:
bin/ci
- Update the version number in
lib/skymap/version.rbandCHANGELOG.md. - Commit, then tag and push:
git tag vX.Y.Z && git push origin vX.Y.Z. - The Release workflow builds and publishes the gem to RubyGems.org using trusted publishing.
Bug reports and pull requests are welcome on GitHub at https://github.com/rhannequin/skymap. This project is intended to be a safe, welcoming space for collaboration, and contributors are expected to adhere to the code of conduct.
The gem is available as open source under the terms of the MIT License. The
data file data/deep_sky_objects.csv is adapted from OpenNGC and released under
CC BY-SA 4.0 (see Data sources). The data
file data/stars.bin merges data of ESA missions and is released under
CC BY-NC 3.0 IGO: it is free to use with credit, and a use that
generates a financial gain needs the authorization of ESA (see Data
sources).
Everyone interacting in the Skymap project's codebases, issue trackers, chat rooms and mailing lists is expected to follow the code of conduct.